
El Segundo home prices average $1,682,428 in November
8 home sales during the month
November was a solid month for both the number of homes that sold as well as the average home prices, bucking the slower market in some other South Bay cities.
8 homes closed escrow compared with 11 in October, and 8 in September.
The average “list” price was $1,712,125 with the average sold price for the homes that sold in El Segundo at $1,682,428 which was a nice increase from $1,583,727 but a bit lower than the very impressive $1,736,856 in September.
Homes that sold averaged a fairly lengthy 75 days on market before going into pending status. The average price per foot was $1,000 which was well up from September.
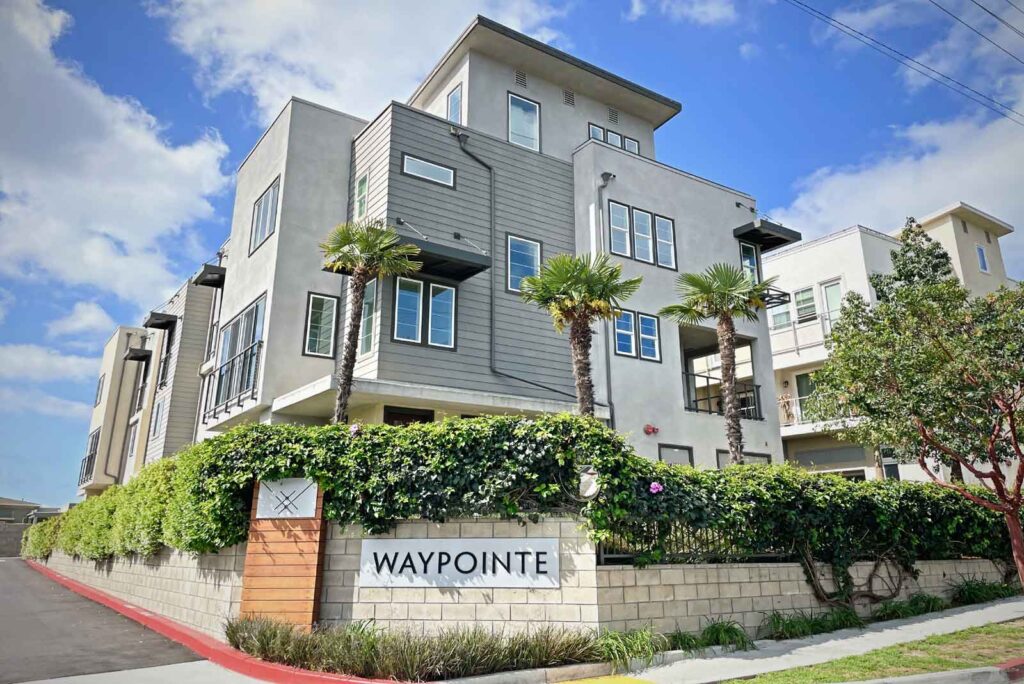
Of the 8 homes the lowest price was a 1 bedroom condo in Pacific Sands complex at 770 W Imperial with another noted sale a townhome in the newer complex of Waypointe El Segundo which sold at $1,128,000.
El Segundo Home Sales and Home Prices for November 2025
| Type | Address | Price | Beds & Baths | Sq feet | Year built | |
| CONDO | 770 W | Imperial #87 | $465,000 | 1/1,0,0,0 | 731 | 1966 |
| SFR | 721 | Bayonne ST | $1,100,000 | 2/1,0,0,0 | 682 | 1918 |
| CONDO | 516 E | Imperial AVE | $1,128,000 | 3/4,0,0,0 | 1670 | 2019 |
| SFR | 841 | Virginia Street | $1,250,000 | 1/1,0,0,0 | 754 | 1922 |
| CONDO | 123 | Richmond ST | $1,591,424 | 2/2,0,1,0 | 2490 | 2004 |
| SFR | 640 | California ST | $2,210,000 | 3/3,0,0,0 | 1987 | 1952 |
| SFR | 318 E | Maple AVE | $2,685,000 | 4/2,2,0,0 | 3907 | 1991 |
| SFR | 618 | Arena ST | $3,030,000 | 5/4,0,0,0 | 3090 | 1962 |
This web site may reference real estate listing(s) held by a brokerage firm other than the broker and/or agent who owns this website. The accuracy of all information is deemed reliable but not guaranteed and should be personally verified through personal inspection by and/or with the appropriate professionals.